
Technical analysis chart patterns are visual representations of price movements in financial markets. Chart patterns are formed by price movements that create recognizable shapes, and these patterns can provide insight into future price movements. Some common chart patterns include head and shoulders, triangles, double tops and bottoms, and flags. Technical analysts use these patterns to identify trends and potential trading opportunities. Chart pattern analysis is often used in conjunction with other technical indicators to form a more comprehensive view of market conditions. While chart patterns can provide useful information, they are not always reliable indicators of future price movements, and should be used in combination with other analysis techniques and risk management strategies.
Here are the 20 Essential Chart Patterns for Trading Success.
Ascending Triangle Bullish Signal

An ascending triangle is a bullish chart pattern in technical analysis, where the upper trendline is flat and the lower trendline is upward sloping. This pattern indicates a period of consolidation followed by a potential breakout to the upside.
Cup and Handle Bullish

The cup and handle is a bullish chart pattern in technical analysis, which is formed when there is a U-shaped price pattern (the “cup”) followed by a smaller downward price move (the “handle”). This pattern typically indicates a bullish trend and a potential upward price continuation. Traders often use this pattern to identify buy opportunities.
Descending Triangle bearish

A descending triangle is a bearish chart pattern typically formed by a horizontal support level and a series of lower highs, creating a triangle shape. This pattern suggests that sellers are gradually gaining control over the market, with the potential for a breakdown below the support level and a continuation of the downtrend.
Double Bottom Reversal Bullish

A double bottom is a bullish chart pattern formed by two distinct lows at approximately the same price level, separated by a temporary peak in between. This pattern suggests that buying pressure has twice been strong enough to overcome selling pressure at a particular level, indicating a potential trend reversal. The price target for a double bottom pattern is typically the distance between the bottom and the temporary peak added to the breakout level.
Double Top Bearish

A double top is a bearish chart pattern formed by two distinct peaks at approximately the same price level, separated by a temporary dip in between. This pattern suggests that selling pressure has twice been strong enough to overcome buying pressure at a particular level, indicating a potential trend reversal. The price target for a double-top pattern is typically the distance between the top and the temporary dip subtracted from the breakout level.
Falling Wedge Bullish

A falling wedge is a bullish chart pattern formed by a series of lower highs and lower lows that converge into a wedge shape. This pattern suggests that sellers are losing momentum, as the price action becomes more and more compressed within a narrower range. The falling wedge pattern is confirmed when the price breaks out above the upper trendline on increased volume. The price target for a falling wedge pattern is typically the height of the wedge added to the breakout level.
Flag Bearish

A bearish flag pattern is a technical chart pattern that is indicative of a downward trend in the market. It is formed by a sharp decline in the price of an asset, followed by a brief consolidation period in which the price trades within a rectangular range. This consolidation period generally takes place on a lower trading volume and can last from a few days to a few weeks. The pattern is confirmed when the price breaks out below the lower trendline with an increase in trading volume, indicating a potential continuation of the downtrend. The price target for the pattern is estimated by subtracting the height of the flagpole (the initial sharp price decline) from the breakout level.
Flag Bullish

A bullish flag is a technical chart pattern that is indicative of a bullish market trend. It is observed during an upward trend where a sharp increase in the price of an asset is followed by a brief consolidation period in which the price trades within a rectangular range. This consolidation period generally takes place on a lower trading volume and can last from a few days to a few weeks. The pattern is confirmed when the price breaks out above the upper trendline on an increased trading volume, which suggests a possible continuation of the bullish trend. The price target for the pattern is estimated by adding the height of the flagpole (the initial sharp price increase) to the breakout level.
Head and Shoulder Bearish
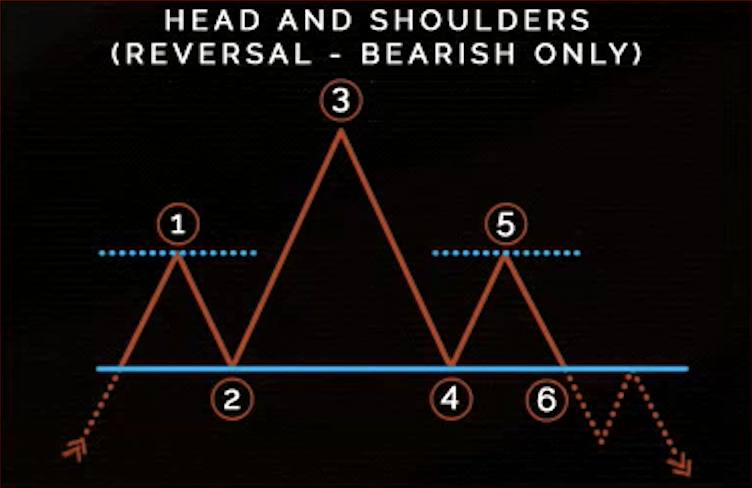
The bearish head and shoulders pattern is a technical chart pattern that suggests a possible reversal of an uptrend. This pattern is formed by three peaks, with the middle peak being the highest, creating a resemblance to the shape of a head and shoulders. To confirm the pattern, the price must break below the neckline, which is a trendline drawn by connecting the lows of the two troughs that flank the middle peak. This breakout below the neckline is usually accompanied by an increase in trading volume, indicating the completion of the pattern. The price target for the pattern is estimated by measuring the distance from the head to the neckline and subtracting it from the breakout level. The bearish head and shoulders pattern is regarded as a signal of a potential reversal of an uptrend, suggesting that the price might continue to decrease in the future.
Inverse Cup and Handle Bearish

The bearish inverse cup and handle pattern is a technical chart pattern that is indicative of a potential reversal of an uptrend. It is formed by a large upside-down “U” shape, resembling a cup, followed by a smaller downward price movement forming a handle. The pattern is completed when the price breaks down below the support level of the handle. This break below the support level is typically accompanied by an increase in trading volume, confirming the pattern. The price target for the pattern is estimated by measuring the height of the cup and subtracting it from the breakdown level. The bearish inverse cup and handle pattern is seen as a signal of a potential reversal of an uptrend, indicating that the price may continue to decline in the future.
Inverse Head and Shoulder

The inverse head and shoulders pattern is a well-known technical chart pattern that suggests a potential reversal of a downtrend. It is formed by three troughs, with the middle trough being the lowest and creating a shape that resembles an upside-down head and shoulders. The pattern is confirmed when the price breaks above the neckline, which is a trendline connecting the highs of the two peaks that surround the middle trough. This break above the neckline is typically accompanied by an increase in trading volume, providing further confirmation of the pattern. The price target for the pattern is determined by measuring the distance from the neckline to the bottom of the head and adding it to the breakout level.
Pennant Bearish

A bearish pennant is a technical chart pattern that occurs when there is a steep drop in a stock’s price, followed by a brief period of consolidation in the form of a triangle or pennant shape, and then a continuation of the downward trend. It is typically considered a bearish signal and can indicate that the stock’s price is likely to continue to decline.
Pennant Bullish

A bullish pennant is a technical chart pattern that occurs when there is a sharp increase in a stock’s price, followed by a brief period of consolidation in the form of a triangle or pennant shape, and then a continuation of the upward trend. It is typically considered a bullish signal and can indicate that the stock’s price is likely to continue to rise.
Rectangle Bearish

A rectangle pattern in technical analysis is a trading range pattern that occurs when a stock’s price trades within a horizontal range, with support at a consistent level and resistance at another consistent level. A rectangle pattern is considered bearish when it occurs after a downtrend, and it suggests that the stock is likely to continue its downward trend after the pattern is completed.
Rectangle Bullish
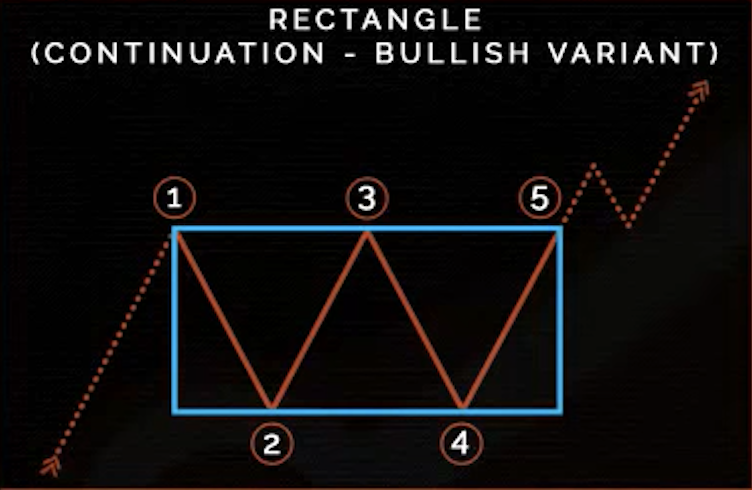
A rectangle pattern is considered bullish when it occurs after an uptrend, and it suggests that the stock is likely to continue its upward trend after the pattern is completed.
Rising Wedge Bearish
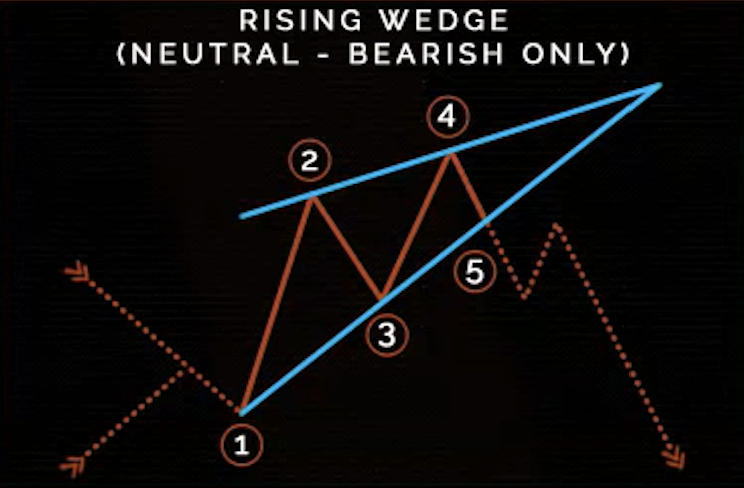
A bearish rising wedge is a technical chart pattern that occurs when a stock’s price is in an uptrend and consolidates between two converging trend lines that slope upwards. This pattern is considered bearish because it suggests that the stock’s price is likely to decline after the pattern is completed. The bearish rising wedge is different from the bullish rising wedge, which occurs in a downtrend and is considered a bullish pattern.
Symmetrical Triangle Bullish

A bullish symmetrical triangle is a chart pattern formed by two converging trend lines that connect a series of higher lows and lower highs. It is considered a continuation pattern, indicating that the price is likely to continue its upward trend after breaking through the upper trend line. Traders often look for bullish indicators such as high trading volume or positive news, to confirm the breakout and enter long positions.
Symmetrical Triangle Bearish

A bearish symmetrical triangle is a chart pattern formed by two converging trend lines that connect a chain of lower highs and higher lows. It is considered a continuation pattern, indicating that the price is likely to continue its downward trend after breaking through the lower trend line.
Triple Bottom Bullish

A bullish triple bottom is a chart pattern that forms when a security’s price reaches a low level three times, with each low being roughly the same and separated by slight upward movements. The pattern is considered a reversal pattern and is usually formed at the end of a downtrend, signaling a potential trend reversal to the upside.
Triple Top Bearish

A bearish triple top is a chart pattern that forms when a security’s price reaches a high level three times, with each high being roughly the same and separated by slight downward movements. The pattern is considered a reversal pattern and is usually formed at the end of an uptrend, signaling a potential trend reversal to the downside.