Understanding MACD
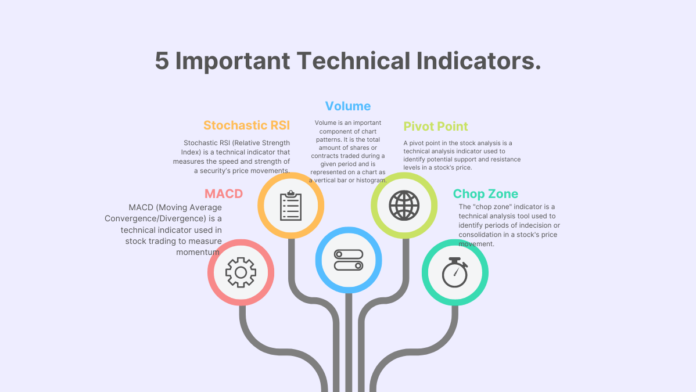
MACD (Moving Average Convergence/Divergence) is a technical indicator used in stock trading to measure momentum and identify possible buying and selling opportunities. It is based on the relationship between two moving averages and a histogram which gives users a visual representation of the crossovers. MACD is mainly used to identify trend reversals and confirm existing trends.
If you are a newbie and cannot understand the details of MACD, see where the two lines are moving. Are they above or below the middle line? All indicators lack behind; you only need to understand the market sentiment by understanding the future predictions.
Understanding Stochastic RSI
Stochastic RSI (Relative Strength Index) is a technical indicator that measures the speed and strength of a security’s price movements. It is calculated by taking the ratio of the current closing price of a security to its price range over a specified period. The Stochastic RSI can be used to identify overbought and oversold levels in security and to generate trading signals. It is often used with other technical indicators to identify entry and exit points.
Stoch RSI is vital to understand if the stock price is overbought or oversold. However, this can only be a prediction and doesn’t imply a bull market. Learn how the line moves and fluctuates carefully. Remember that if you have been analyzing the market for years, your assumption could be more correct than the data shown in RSI.
Understanding Volume
Volume is an important component of chart patterns. It is the total amount of shares or contracts traded during a given period and is represented on a chart as a vertical bar or histogram. Volume can be used to confirm a price trend, identify reversals, and identify breakouts and breakdowns. Volume is also used to measure the strength of a move, as an increase in volume often signals an increase in the intensity of a price move.
Volume is everything in technical analysis. The volume shows if the market is in a bull run or the bear run. Always see if the volume is ascending or descending. The ascending volume shows the bull market is near, and the drop in volume trend shows the bear market is near.
Pivot Point is Important
A pivot point in the stock analysis is a technical analysis indicator used to identify potential support and resistance levels in a stock’s price. It is calculated using the stock’s previous day’s high, low and closing prices. The pivot point and its related support and resistance levels can then be used to forecast the stock’s likely trading range for the upcoming trading day.
The secret of chop zone indicator
The “chop zone” indicator is a technical analysis tool used to identify periods of indecision or consolidation in a stock’s price movement. It is typically represented by a shaded area on a stock chart and is used to indicate a range in which the stock’s price fluctuates without a clear direction.
The chop zone indicator can be useful for traders and investors because it can signal a potential opportunity to buy or sell a stock. For example, if a stock’s price is in a chop zone and appears to be consolidating, a trader may wait for a breakout in either direction before making a trade.
Always see the red and green zone in the chop zone indicator. After a long red zone, the green will follow. Learn to buy at the end of the red zone.
