
3 6 9 as the key to the universe.
Tesla referred to the idea that the universe is composed of energy and that everything is made of a combination of energy, frequency, and vibration. Here the number 3, 6, and 9 is important to the idea.
It is believed that this number holds the key to understanding the universe. By understanding the nature of energy, frequency, and vibration, one can gain insight into the workings of the universe. It is thought that by understanding the fundamental principles of energy, frequency, and vibration, one can unlock the secrets of the universe and gain a better understanding of the interconnectedness of all things.
The Recurring Figure three.
One of the crucial points is that all strategy works if you follow it and understand its underlying meaning. The purpose of the chart pattern is to give insight to the users who are interested and want to scrutinize all the values assigned to them.
After analyzing Fibonacci trading tools and other chart patterns, there is a common denominator. Figure three is dominant in all of such patterns. We can see the recurring three in all waves.
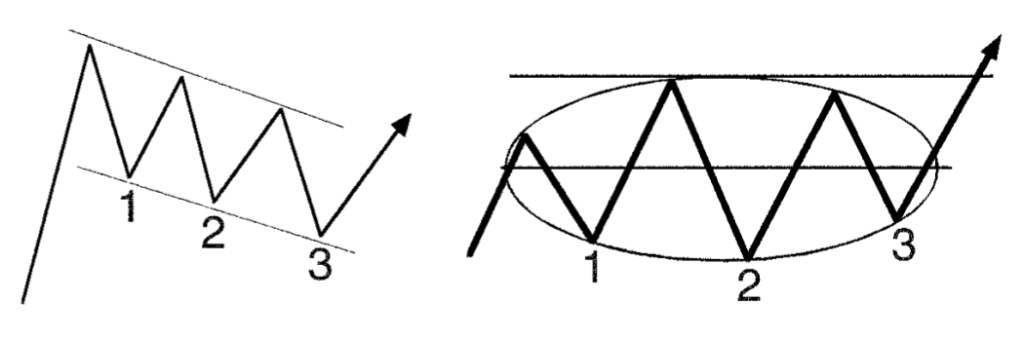
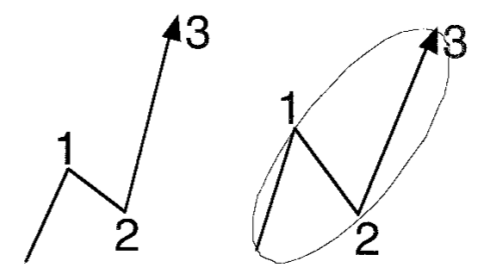

- The three waves exist before the bull pattern.
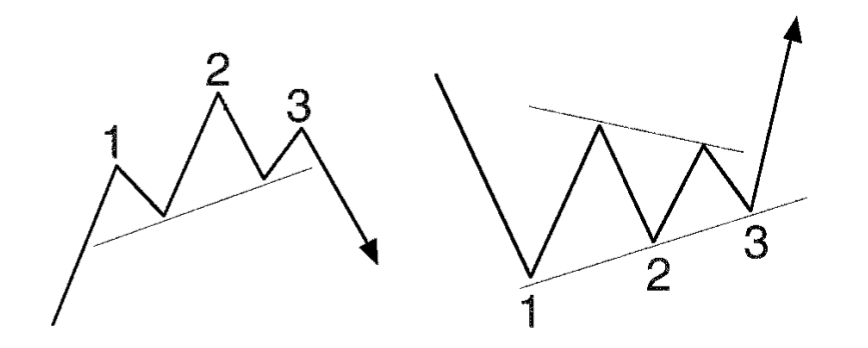
- The three waves exist before the bear pattern.
- The three symmetries in the ascending and descending triangles.
- The three peaks are in the formation of a head and shoulder pattern.
If you focus only on trading, then looking into the chart patterns for the three movements is essential. The users can only notice the other signs and patterns if they focus more on determining the triple bottom or triple resistance. However, there is an opportunity for money to be made.
The two theories of the stock market to success.
The price will never go below the final resistance.
When the price is falling down, at one point it hits the lower low. In the bear market, if the price bounces back, it is likely to hit the support point again. The market can go sideways with lower lows and lower highs for a period of time.
Bull market after a long time breaks all-time high.
You have been holding your stocks for a long period, and finally, you see the increase in volume. Wait some months before you sell; it takes time to hit an all-time high after it bounces back. When the price breaks resistance, it will make an all-time high. Remember, there should be a long bear market for this to happen. Wait until the price consolidates before deciding to sell. Being patient and having a long-term mindset can help you benefit from the stock market.